Reports
Your sales over time, what sells best, how customers pay, your profit, and a daily summary for cashing up.
In the console: Reports
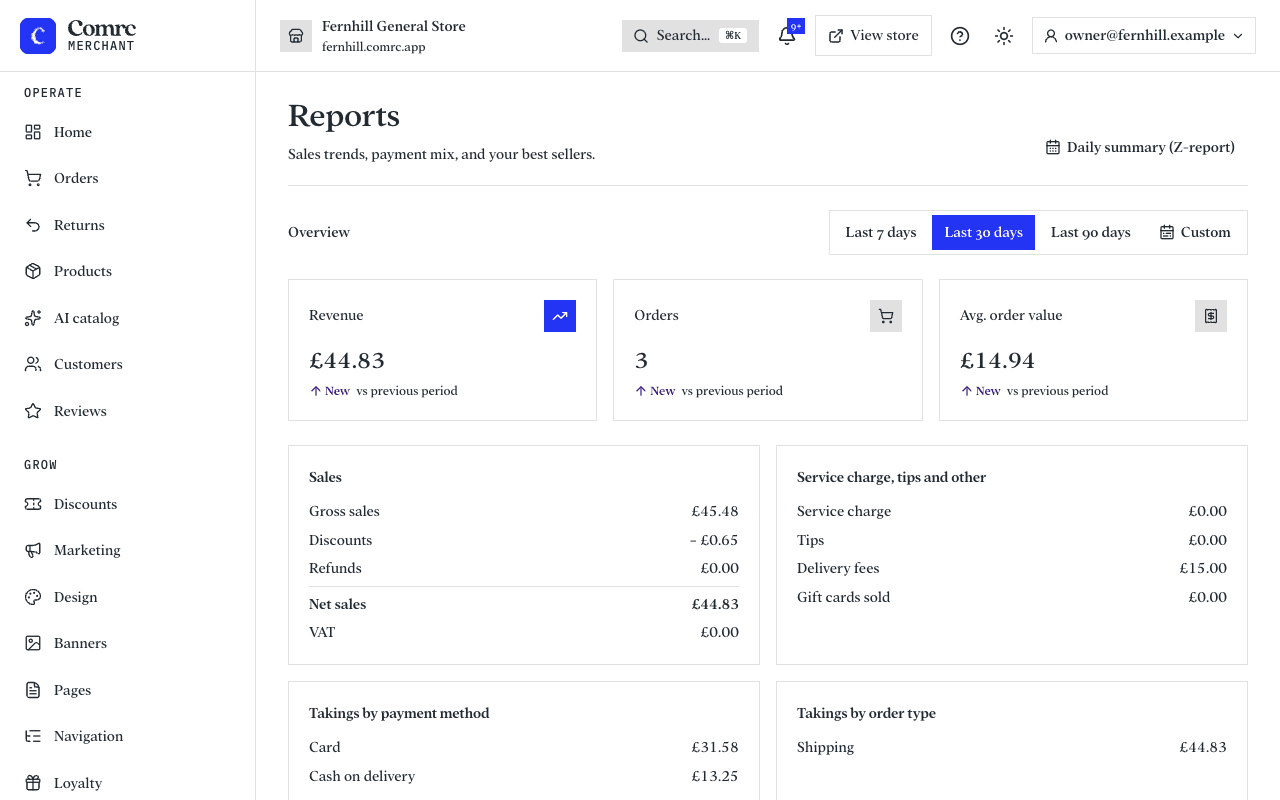
Home gives you the headline numbers. Reports goes deeper, for any date range you choose, and compares it with the period before. Choose Today, 7 days or 30 days, or Custom to pick your own dates. Days run on UK time.
What you'll find
- Revenue over time, with the change against the previous period.
- Sales — gross sales, discounts, refunds and net sales, and the VAT in them.
- Takings by payment method, and by order type.
- Top sellers, by units sold. Export CSV downloads the table.
- Gross profit and margin, from your net sales and the cost of what you sold.
Getting profit right
Profit uses each product's cost price. A product without one isn't counted, and the report tells you how many units that affects. Add cost prices on your products to include them. Customers never see a cost price.
The daily summary
The daily summary, or Z-report, is one day's takings on one page: sales, VAT, payment methods, and for food businesses service charge and tips, listed separately so you can share them out. Open it from the Daily summary (Z-report) button on Reports, step between days with the previous and next arrows or pick a day, and press Print or Export CSV.
Note Only paid orders are counted. Gift cards sold are shown separately and aren't part of sales, because they are counted when they're spent.
Still stuck?
Email support@comrc.app and we'll help you out.